
Ever had report usage data and needed to figure out which day of the week is quietest so you can do maintenance? Want to visualize spikes in sales activity based on hour ranges within the day? Need a date or time dimension for a proof of concept in Power Pivot before you bother to spin up a real data warehouse? You’ve come to the right place!
Many excellent BI bloggers have covered creating a basic date dimension using Power Query. Indeed, I learned a great deal from Chris Webb and Matt Masson as I was creating my own date & time dimension toolkit. What I’d like to cover in this admittedly long post is how to create Power Query functions that you can spin up and configure quickly in Power Pivot. These functions build in the fields you need for both the attributes you display and the hidden fields you use to make those display nicely.
This post has a number of origins, but the more often I had to quickly model and filter data based on a calendar or time clock, the more I thought “This is annoying, I need to automate this”. I wanted something that I could spin up in fifteen minutes or less so I could get on with analyzing the data. For example, we recently wanted to determine whether people were using a particular SSAS cube all week or if it could be downgraded from a daily refresh schedule to just weekly. That meant we needed to aggregate not based on “July” or “Week 52” but instead by “Monday”, “Wednesday”, etc. Even better if I could show usage based on abstract time concepts like “Morning” vs. “Afternoon”. I had the usage log data, but I needed it to be useful.
Toolkit Components
- DateConfig Excel table
- CreateDateTable Power Query function
- CreateTimeTable Power Query function
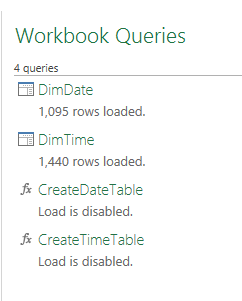
- DimDate Power Query query
- DimTime Power Query query
- Power Pivot model configuration of dimensions
You can download the toolkit here Date_Time_Template_GFM and start poking around now, but please do read on. Each piece of the toolkit has a good purpose. 🙂
DateConfig Excel Table
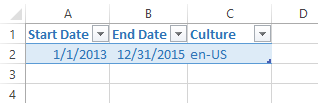
If I was going to automate the process of creating a date dimension on the fly, the first thing I needed was a way to quickly supply the start and end date for the dimension. I could always edit the Power Query query that creates the resultset, but that seemed clunky. A hard-coded solution! Blech! Courtesy of this post (again from Chris Webb, buy his Power Query book!) I learned that I could put my parameter values in an Excel table and reference them from within the query. Matt Masson’s post about creating a date dimension notes that we can pass in a culture value, which is worth doing if you’re working with multi-lingual or multi-location users. After all, don’t you think your Spanish-speaking customers would appreciate seeing a POC that shows “Viernes” instead of “Friday”? See this MSDN documentation for the available cultural configurations.
CreateDateTable Power Query Function
Next to leverage some more reusability: function objects in Power Query. These allow you to invoke one set of code several times (Checkout Date & Return Date), and it’s one of the code snippets I keep handy to paste & go. You can copy this code snippet and create a new Blank Query from the Other Sources drop-down.
If you haven’t seen the Power Query M language before, comments are denoted by // characters. This example is interpreted as a function because it doesn’t return a resulting table or row. It will appear in your Power Query navigator as “Load is Disabled”, but you can use the Invoke button to test it in the editor. Just remember to delete that Invoke test step when you’re done.
let CreateDateTable = (StartDate as date, EndDate as date, optional Culture as nullable text) as table =>
  let
    // Determine number of days between start and end date
    DayCount = Duration.Days(Duration.From(EndDate - StartDate)),
    // Add a day back, as Duration math above will give you the days literally between rather than inclusive. Ex Dec 31 - Dec 1 = 30 days, but we need 31 days in that period
    DayCountAdd = DayCount + 1,
    // Create a Dates list object starting at the start date, for the duration of the day count, increment of one year
    Source = List.Dates(StartDate,DayCountAdd,#duration(1,0,0,0)),
    // Turn that date list into a table
    TableFromList = Table.FromList(Source, Splitter.SplitByNothing()),
    // Update the type to Date
    ChangedType = Table.TransformColumnTypes(TableFromList,{{"Column1", type date}}),
    // Rename the only column in the table to date
    RenamedColumns = Table.RenameColumns(ChangedType,{{"Column1", "Date"}}),
    // Insert columns for different units within the date dimension and supporting columns for sorting
    // Optional Culture parameter is used where applicable
    InsertYear = Table.AddColumn(RenamedColumns, "Year", each Date.Year([Date]), type number),
    InsertQuarter = Table.AddColumn(InsertYear, "QuarterNumber", each Date.QuarterOfYear([Date]), type number),
    InsertMonth = Table.AddColumn(InsertQuarter, "MonthNumber", each Date.Month([Date]), type number),
    InsertDay = Table.AddColumn(InsertMonth, "DayOfMonth", each Date.Day([Date]), type number),
    InsertDayInt = Table.AddColumn(InsertDay, "DateInt", each [Year] * 10000 + [MonthNumber] * 100 + [DayOfMonth], type number),
    InsertMonthName = Table.AddColumn(InsertDayInt, "Month", each Date.ToText([Date], "MMMM", Culture), type text),
    InsertCalendarMonth = Table.AddColumn(InsertMonthName, "Month Of Year", each (try(Text.Range([Month],0,3)) otherwise [Month]) & " " & Number.ToText([Year])),
    InsertCalendarQtr = Table.AddColumn(InsertCalendarMonth, "Quarter of Year", each "Q" & Number.ToText([QuarterNumber]) & " " & Number.ToText([Year])),
    InsertDayWeek = Table.AddColumn(InsertCalendarQtr, "DayInWeek", each Date.DayOfWeek([Date]), type number),
    InsertDayName = Table.AddColumn(InsertDayWeek, "Day Of Week Name", each Date.ToText([Date], "dddd", Culture), type text),
    InsertWeekStarting = Table.AddColumn(InsertDayName, "Week Starting", each Date.StartOfWeek([Date]), type date),
    InsertWeekEnding = Table.AddColumn(InsertWeekStarting, "Week Ending", each Date.EndOfWeek([Date]), type date),
    InsertMonthYrSort = Table.AddColumn(InsertWeekEnding, "MonthYrSort", each Date.ToText([Date], "yyyyMM", Culture), type number),
    InsertQuarterSort = Table.AddColumn(InsertMonthYrSort, "QuarterYrSort", each Number.ToText([Year]) & Number.ToText([QuarterNumber]), type number),
    ChangeTypes2 = Table.TransformColumnTypes(InsertQuarterSort, {{"MonthYrSort", type number},{"QuarterYrSort", type number}}),
    InsertWeekOfYr = Table.AddColumn(ChangeTypes2, "Week", each "Week " & Number.ToText(Date.WeekOfYear([Date])), type text)
  in
    InsertWeekOfYr
in
    CreateDateTable
CreateTimeTable Power Query Function
While date dimensions get a lot of coverage in the blogosphere, I oddly couldn’t find much for time dimensions, especially when it came to generating them via Power Query. However, this post from Brent Greenwood gave me great ideas for the attributes to include. I particularly liked the way he created a “Period” concept. If the periods below don’t fit the bill for you, consider other definitions: First Shift vs. Second Shift, Core Hours vs. Overtime, or other classifications that make sense to your business.
The query below is something I created through trial and error, as these functions aren’t fully documented in the Power Query M language guide (yet).
let CreateTimeTable = () as table =>
 let
 // Similar to our CreateDateTable script, we start with the smallest unit of the dimension, minute
 // There are a fixed number of minutes in a day, so no need for parameters here
 // 525,600 minutes divided by 365 days in a year = 1440 minutes in a day.
 // Who says we never learn from Broadway musicals?
 MinuteCount = 1440,
 // Now create a Time type list for a total of 1440 minutes, incrementing one minute at a time
 Source = List.Times(#time(0, 0, 0),MinuteCount, #duration(0,0,1,0)),
 // Turn that list into a one column table
 TableFromList = Table.FromList(Source, Splitter.SplitByNothing()),
 // Change that table's one column to type Time
 ChangedType = Table.TransformColumnTypes(TableFromList,{{"Column1", type time}}),
 // Rename column to Time
 RenamedColumns = Table.RenameColumns(ChangedType,{{"Column1", "Time"}}),
 // Start inserting columns for each unit of time to represent in the dimension
 InsertHour = Table.AddColumn(RenamedColumns, "Hour", each Time.StartOfHour([Time])),
 InsertMinute = Table.AddColumn(InsertHour, "Minute", each Time.Minute([Time])),
 ChangedTypeHour = Table.TransformColumnTypes(InsertMinute,{{"Hour", type time}}),
 // Creating levels in the hierarchy that might be useful for reporting. Omit if not useful to yours
 InsertQuarterHour = Table.AddColumn(ChangedTypeHour, "Quarter Hour", each if [Minute]<15 then [Hour] else if [Minute] < 30 then Value.Add([Hour],#duration(0,0,15, 0)) else if [Minute] < 45 then Value.Add([Hour],#duration(0,0,30, 0)) else Value.Add([Hour],#duration(0,0,45, 0))),  ChangedTypeQtrHr = Table.TransformColumnTypes(InsertQuarterHour,{{"Quarter Hour", type time}}),  ReorderedColumns = Table.ReorderColumns(ChangedTypeQtrHr,{"Time", "Hour", "Quarter Hour", "Minute"}),  InsertHourNumber = Table.AddColumn(ReorderedColumns, "Hour Number", each Time.Hour([Time])),  NextHour = Table.AddColumn(InsertHourNumber, "Next Hour", each Value.Add([Hour],#duration(0,1,0, 0))),  NextQuarterHour = Table.AddColumn(NextHour, "Next Quarter Hour", each Value.Add([Quarter Hour],#duration(0,0,15, 0))),  InsertPeriod = Table.AddColumn(NextQuarterHour, "Period of Day",   each if [Hour Number] >= 0 and [Hour Number] < 4 then "After Midnight" else   if [Hour Number] >= 4 and [Hour Number] < 8 then "Early Morning" else  if [Hour Number] >= 8 and [Hour Number] < 12 then "Late Morning" else  if [Hour Number] >= 12 and [Hour Number] < 16 then "Afternoon" else  if [Hour Number] >= 16 and [Hour Number] < 20 then "Evening" else "Late Night"),  InsertPeriodSort = Table.AddColumn(InsertPeriod, "PeriodSort", each   if [Hour Number] >= 0 and [Hour Number] < 4 then 0 else   if [Hour Number] >= 4 and [Hour Number] < 8 then 1 else  if [Hour Number] >= 8 and [Hour Number] < 12 then 2 else  if [Hour Number] >= 12 and [Hour Number] < 16 then 3 else  if [Hour Number] >= 16 and [Hour Number] < 20 then 4 else 5),
 InsertTimeKey = Table.AddColumn(InsertPeriodSort, "TimeKey", each Time.ToText([Time], "HHmm"), type text)
 in
 InsertTimeKey
in
 CreateTimeTable
Incidentally, one of the best tricks I’ve learned for reverse-engineering the M language is to perform the transform I want in the editor via the friendly buttons, then looking at the Advanced Editor to see the code. I may choose to reorder or rename, but it’s the best way to find out what the syntax should look like.
DimDate Query
Time to put our functions to work to generate some data! This query is also started via the Other Sources > Blank Query dialog because we need to do more than just invoke a function. We need to pass in parameters from our Excel table. MAKE SURE YOU LOAD YOUR QUERY RESULTS TO THE DATA MODEL. I’m sure the Power Query team is working on allowing us to default that as our preferred option if they haven’t already. It’s so rare for me to want anything from PQ to get dumped to a worksheet. The whole point it to get that data modeled!
Note that if you were using this toolkit to create several date tables, you’d need to create one query per set of date data you need. For example, if your dataset has both CheckoutDate and ReturnDate that you’d like to filter on, you’ll need two date tables in the Power Pivot model.
let
    //Get named table of start and end date values from Excel workbook
    DateTable = Excel.CurrentWorkbook(){[Name="DateConfig"]}[Content],
    //Change the date-related columns from datetime to date
    ChangeTypes = Table.TransformColumnTypes(DateTable, {{"Start Date", type date}, {"End Date", type date}}),
    //Get the Start Date column from the table
    StartDateRec = Table.Column(ChangeTypes, "Start Date"),
    //Get the End Date column from the table
    EndDateRec = Table.Column(ChangeTypes, "End Date"),
    //Get the culture from the table
    CultureRec = Table.Column(ChangeTypes, "Culture"),
    //Pass the first value in each column to the CreateDateTable function.
   // For a list of culture options, see http://msdn.microsoft.com/en-us/goglobal/bb896001.aspx
    CreateCheckoutDate = CreateDateTable(StartDateRec{0}, EndDateRec{0}, CultureRec{0})
in
    CreateCheckoutDate
DimTime Query
This time (yes, I see all the puns I’m creating here) we don’t need to worry about parameters, so we just need to invoke our CreateTimeTable function. Right-click or hover over the CreateTimeTable function in the Power Query Workbook Queries window and the Invoke option should appear for you. AGAIN, MAKE SURE YOU LOAD YOUR QUERY RESULTS TO THE DATA MODEL. Loading to the worksheet isn’t going to do us any good here, we’ve got more work to do.
Et voila! Time data!
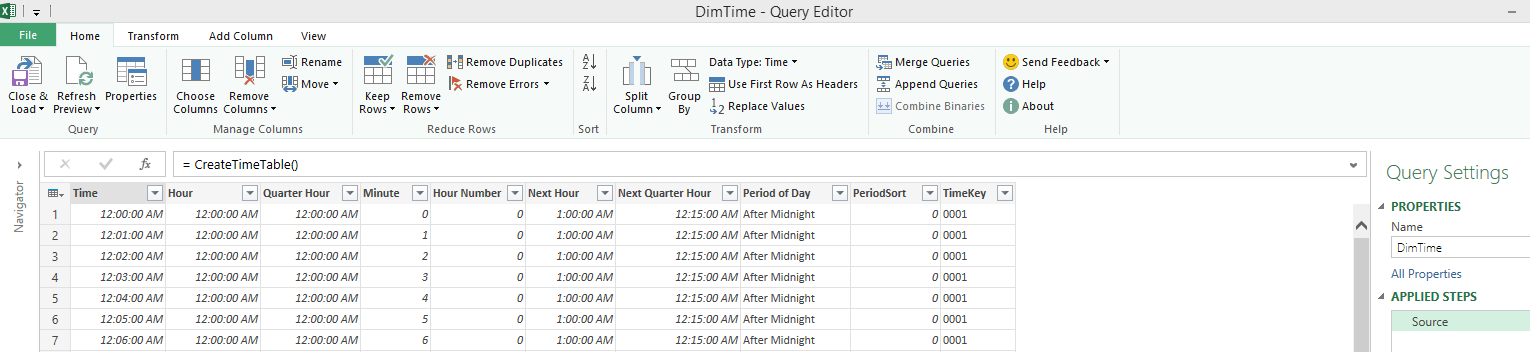
If you’re wondering what those “Next Hour” and “Next Quarter Hour” results are all about, stay tuned. Their purpose will become clearer in Power Pivot.
Power Pivot Model Configuration
Now that we have our date and time data loaded into the Excel data model, aka manageable in Power Pivot, it’s time to get it spiffed up. Here’s a checklist of what to do with each. Be sure to take a look at these configurations in the toolkit Date_Time_Template_GFM , they’ll make the most sense there.
DimDate To-Do’s
![]()
- Make sure each of the date columns is seen as Data Type Date
- Change the format for each date column to what’s appropriate for your purposes. I chose the Short Date format (*3/14/2001)
- Hide from Client tools the numeric columns that are just for sorting or use as a key value
- I also hide the “Month” column. I don’t like to leave any attribute available on its own that is going to perform strangely outside a hierarchy. If you have a pivot table or chart showing activity per month, I want it to be really obvious if we’re spanning more than one year. Having two January’s worth of sales data in one chart bar is misleading without the context of the Year.
- Set the Sort By Column for the visible columns that aren’t already date or numeric fields: Month, Month of Year, Quarter of Year, Day of Week Name
- Change your view to Diagram View so you can create the hierarchy
 Click the Create Hierarchy button.
- Drag the hierarchy members into the hierarchy. Note that you have some latitude when it comes to the “Week” member – “Week”, “Week Starting”, or “Week Ending” could work, it just depends on what you think makes sense for the data you’re analyzing.
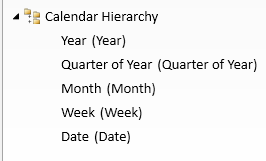
It’s worth taking a few moments to configure a hierarchy, as it’s nice to just plop one onto a pivot table and click-click-click through totals and subtotals at different levels. It also makes filtering more convenient. “I want to see the totals just for Q3 2014…wait, was that also happening for all of 2014?”
DimTime To-Do’s
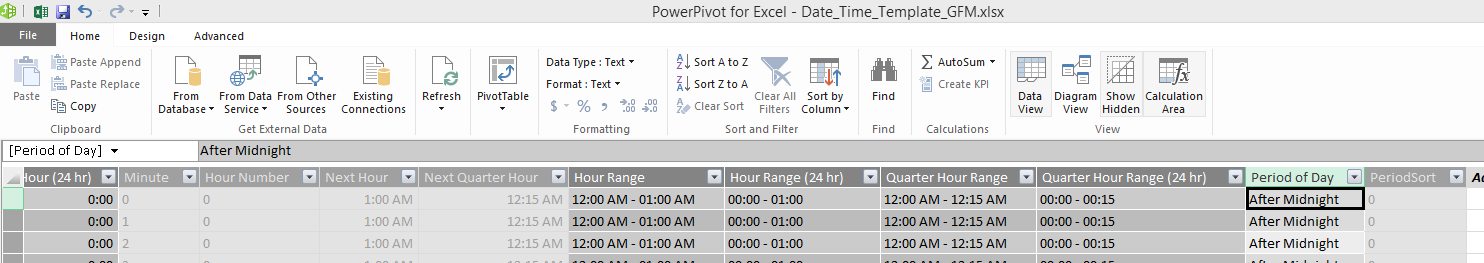
- Make sure each of the time columns are type Date. Next Hour and Next Quarter hour are bound to be “Text” instead, and that’s going to goof stuff up.
- Format each time column with the time format that suits your purposes, such as “1:30 PM”
- Hide the TimeKey, PeriodSort and other numeric columns you won’t be using from the client tools.
- Configure the Sort By Column for the Period of Day.
- Optional: create the Hour Range and Quarter Hour Range columns. These came from creating a clearer chart for a user recently. When presented with a line chart that showed activity per Quarter Hour, the user didn’t find it very intuitive. Did we mean before or after 12:15 when we showed 12:15? She found bars labeled “12:00 PM – 12:15 PM” to be much more intuitive. If you think that will help you as well, see the DAX formulas below.
- Optional: if you need to work with a 24-hour clock, see the toolkit for details!
- Switch to the Diagram View to add a Time Hierarchy – two if you’re allowing both a 12 hr and 24 hr clock option.
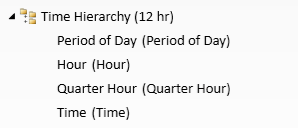
Hour Range: FORMAT([Hour], “Medium Time”) & ” – ” & FORMAT([Next Hour], “Medium Time”)
Quarter Hour Range: FORMAT([Quarter Hour], “Medium Time”) & ” – ” & FORMAT([Next Quarter Hour], “Medium Time”)
Medium Time you say? Why not Short Time? Julie Koesmarno aka MSSQLGirl shows us why.
Conclusion
If you’ve made it this far, well done you! I hope you find this helpful for data analysis large & small. If you’d like to see this code connected to actual data and being general useful, come to the October MADPASS meeting or SQL Saturday #332 in Minneapolis!
